
2 Jan
2015
2 Jan
'15
12:55 p.m.
Good day,
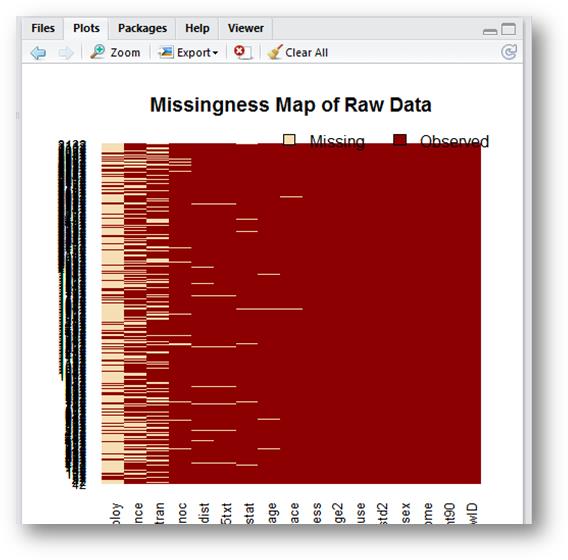
I have a question about missmap() that might be fairly simple, but it is
not so for me. When I use missmap() the legend and the plot overlap. How
can I move the legend upwards so that the overlapping doesn’t happen?
I have used the locator() function to locate the point where I want the
legend to be, but nothing happens when I write this: missmap(psub,
main="Missingness Map of Raw Data", xlim=c(87.66, 18),
ylim=c(3289.589,3327)).
I’m using R Studio if that makes any difference.
I appreciate any suggestions.
Thank you,
*Heidy Colón-Lugo, M.S.*

4 Jan
4 Jan
6:09 p.m.
Heidy,
Rstudio has it's own margin default definitions for plots that overwrite the R
defaults, which is clearly messing this graph up. I'll come up with a solution and
post an answer shortly.
James
--
James Honaker, Senior Research Scientist
//// Institute for Quantitative Social Science, Harvard University
________________________________
From: amelia-bounces(a)lists.gking.harvard.edu [amelia-bounces(a)lists.gking.harvard.edu] on
behalf of Heidy Colón-Lugo [heidycolon(a)gmail.com]
Sent: Friday, January 02, 2015 12:55 PM
To: amelia(a)lists.gking.harvard.edu
Subject: [amelia] Fwd: question about missmap()
Good day,
I have a question about missmap() that might be fairly simple, but it is not so for me.
When I use missmap() the legend and the plot overlap. How can I move the legend upwards so
that the overlapping doesn’t happen?
[cid:image005.jpg@01D02681.0DF01960]
I have used the locator() function to locate the point where I want the legend to be, but
nothing happens when I write this: missmap(psub, main="Missingness Map of Raw
Data", xlim=c(87.66, 18), ylim=c(3289.589,3327)).
I’m using R Studio if that makes any difference.
I appreciate any suggestions.
Thank you,
Heidy Colón-Lugo, M.S.
3407
days inactive
3409
days old
amelia@lists.gking.harvard.edu
1 comments
2 participants
participants (2)
-
 Heidy Colón-Lugo
 -
 Honaker, James