
15 Nov
2010
15 Nov
'10
5:39 a.m.
Hey James! How are you? Such a long time. We miss you!
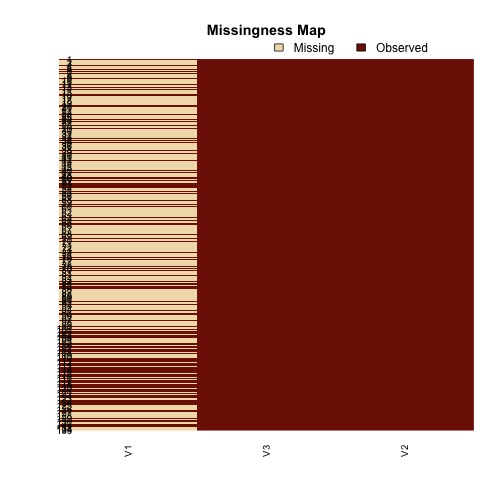
Thank for your reply: basically using your tip everything run but the map is
kind of weird: I think it is plotting the 3 variables of the my date set,
when I actually care just about the first one. Thus I dunno how to select
the variable I really one see. If try this I get an error message:
quartz()
missmap(k1[,1],csvar=3,tsvar=2)
Error in colMeans(is.na(obj)) :
'x' must be an array of at least two dimensions
If I do the following code I get the attached graph, which is really the
thing I wanna plot:
k1 <-cbind(data1$INFMORT,data1$YEAR,data1$COUNTRY)
k1 <-as.data.frame(k1)
k1 <- as.matrix(k1)
str(k1)
num [1:4126, 1:3] 160 NA NA NA NA ...
- attr(*, "dimnames")=List of 2
..$ : NULL
..$ : chr [1:3] "V1" "V2" "V3"
dim(k1)
[1] 4126 3
head(k1)
V1 V2 V3
[1,] 160 1962 1
[2,] NA 1963 1
[3,] NA 1964 1
[4,] NA 1965 1
[5,] NA 1966 1
[6,] 150 1967 1
quartz()
missmap(k1,csvar=3,tsvar=2)
Thank your for your time!