
18 Nov
2015
18 Nov
'15
5:33 p.m.
Hi I'm working with cross country time series data, along with binary
variables as dependent variables.
I'm sure it's something simple, but wondering if anyone would be willing to
provide any feedback. I'd very much appreciate it.
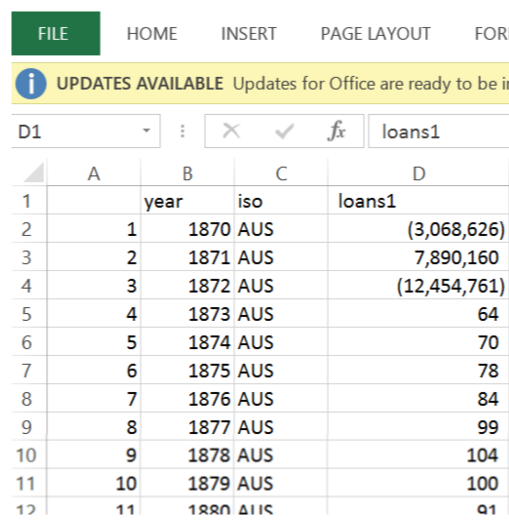
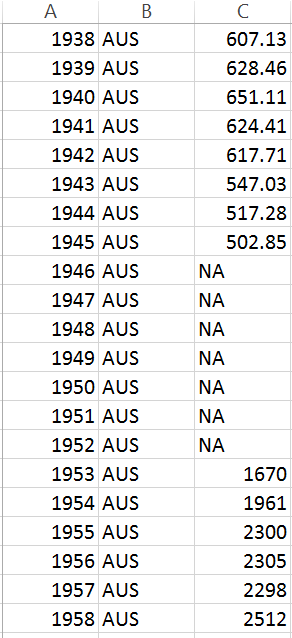
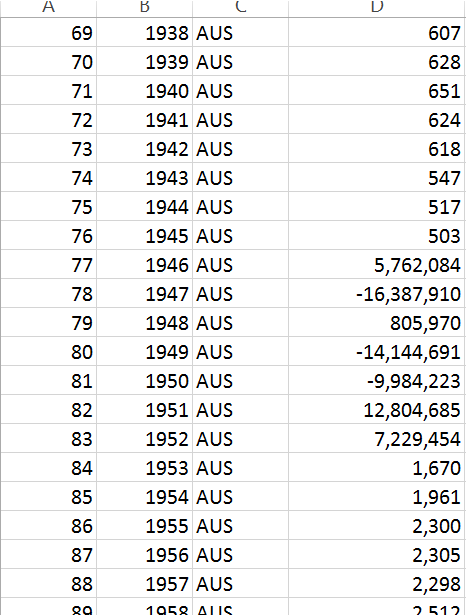
Here you can see one of the features with missing values and the imputed
values using Amelia II for the country AUS from 1870 to 1872 at the
beginning of the time series, then again from 1946-1952. ,
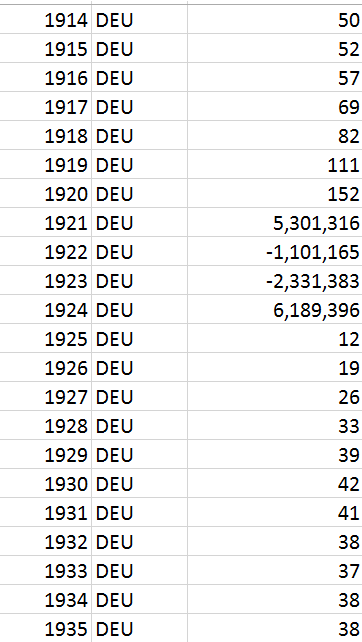
The numbers imputed are nonsensical, in that they appear to be sampled from
the broader cross section of countries, and there is no trend to them.
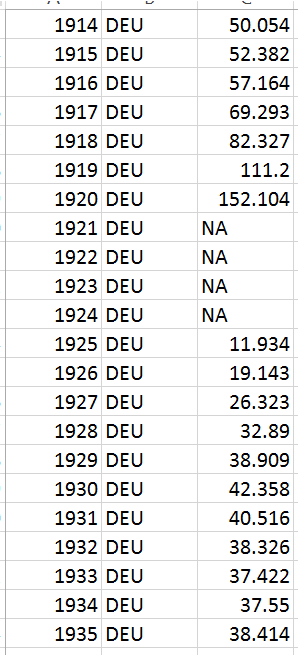
For this type of study, it is common to use linear interpolation. Here is
the code, data, and screenshots.
Also, if anyone wants to me help me build models to forecast crises of
various sorts, that'd be great too. I'm a noob at the modeling but have a
lot of ideas for good models. .
Thanks again,
Brendan
#data wrangling
library(dplyr)
library(Amelia)
#impute missing values
RRcrisis_panel <- read.csv("schularick_taylor_RRcrises_panel.csv")
head(RRcrisis_panel)
RRcrisis_panel_loans1 <- select(RRcrisis_panel, year, iso, loans1)
a.RRcrisis_panel <- amelia(RRcrisis_panel_loans1,
m = 3,
ts = "year",
cs = "iso",
polytime = 1)
#look at individual impututations
a.RRcrisis_panel$imputations[[1]]
head(a.RRcrisis_panel$imputations[[1]])
#save the five different imputations
write.amelia(obj=a.RRcrisis_panel, file.stem = "amelia_11_16_2015")
Before Imputing
[image: Inline image 2]
After Imputing
[image: Inline image 1]
Before Imputing
[image: Inline image 3]
After Imputing:
[image: Inline image 4]
Before Imputing
[image: Inline image 1]
after imputing
[image: Inline image 2]
ᐧ